Total Lunar Eclipse of -0543 Mar 13 (0544 Mar 13 BCE)
Fred Espenak
Introduction
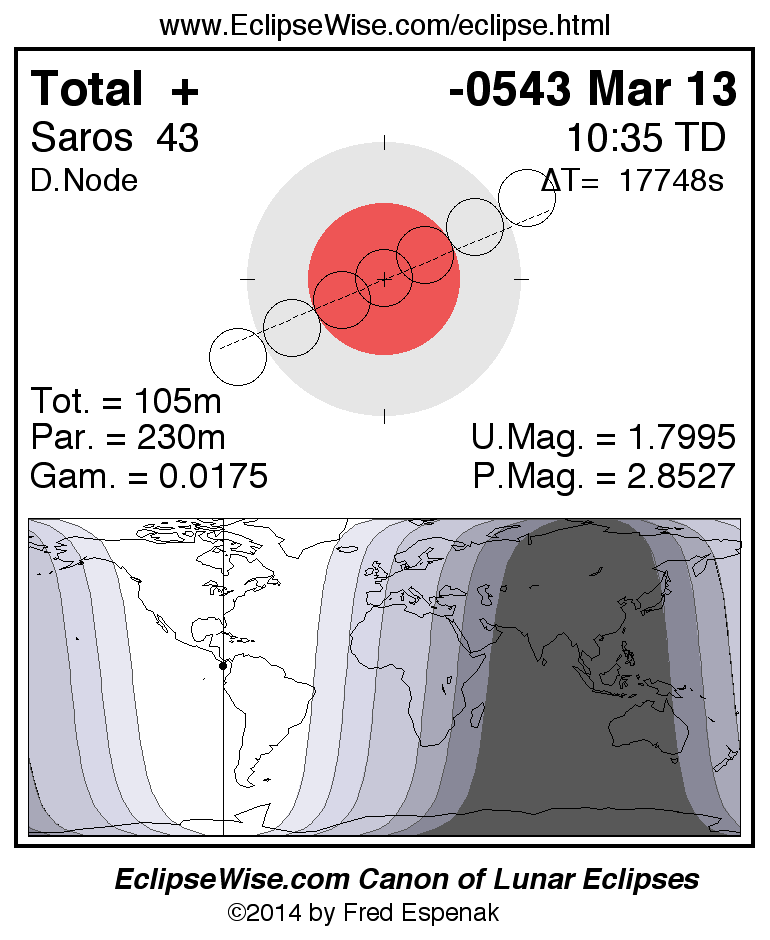
The Total Lunar Eclipse of -0543 Mar 13 (0544 Mar 13 BCE) is visible from the geographic regions shown on the map to the right. The diagram above the map depicts the Moon's path with respect to Earth's umbral and penumbral shadows. Click on the figure to enlarge it. For an explanation of the features appearing in the figure, see Key to Lunar Eclipse Figures.
The instant of greatest eclipse takes place on -0543 Mar 13 at 10:34:35 TD (05:38:49 UT1). This is 4.9 days after the Moon reaches apogee. During the eclipse, the Moon is in the constellation Virgo. The synodic month in which the eclipse takes place has a Brown Lunation Number of -30498.
The eclipse belongs to Saros 43 and is number 53 of 87 eclipses in the series. All eclipses in this series occur at the Moon’s descending node. The Moon moves northward with respect to the node with each succeeding eclipse in the series and gamma increases.
This total eclipse is central meaning the Moon’s disk actually passes through the axis of Earth’s umbral shadow. It has an umbral eclipse magnitude of 1.7995, and Gamma has a value of 0.0175. Because they are so deep, such eclipses typically have the longest total phases. In this case, the duration of totality lasts 104.5 minutes. That qualifies the eclipse as a member of a select class of exceptionally long total eclipses with durations exceeding 100 minutes.
The total lunar eclipse of -0543 Mar 13 is preceded two weeks earlier by a partial solar eclipse on -0543 Feb 26, and it is followed two weeks later by a partial solar eclipse on -0543 Mar 27.
These eclipses all take place during a single eclipse season.
The eclipse predictions are given in both Terrestrial Dynamical Time (TD) and Universal Time (UT1). The parameter ΔT is used to convert between these two times (i.e., UT1 = TD - ΔT). ΔT has a value of 17746.2 seconds for this eclipse. The uncertainty in ΔT is 446.6 seconds corresponding to a standard error in longitude of the eclipse visibility zones of 1.87°.
The following links provide maps and data for the eclipse.
- Eclipse Figure - eclipse geometry diagram and map of eclipse visibility
- Saros 43 Table - data for all eclipses in the Saros series
The tables below contain detailed predictions and additional information on the Total Lunar Eclipse of -0543 Mar 13 .

